London Microservices User Group - April 2019. Hosted at FarFetch.
This talk focuses on the how we have evolved our approach to application monitoring at Attest over the last 3 years that I’ve been working there.
Overview
Starting with the history of attest, we walk through the very basic approach we had to monitoring and alerting back in April 2016. Touching on each of the changes that we made taking the architecture and platform through:
- StatusCake and AMIs baked on EC2 Instances
- Apps in Docker running on ECS with Application load balancer metrics
- Linkerd1 and our first experiences with a service mesh
- Zipkin and the troubles trying to get a distributed tracing system to give aggregated metrics.
- Kubernetes with Prometheus and AlertManager
- Linkerd2 and our current approach to building an “Internal PaaS” for the feature teams.

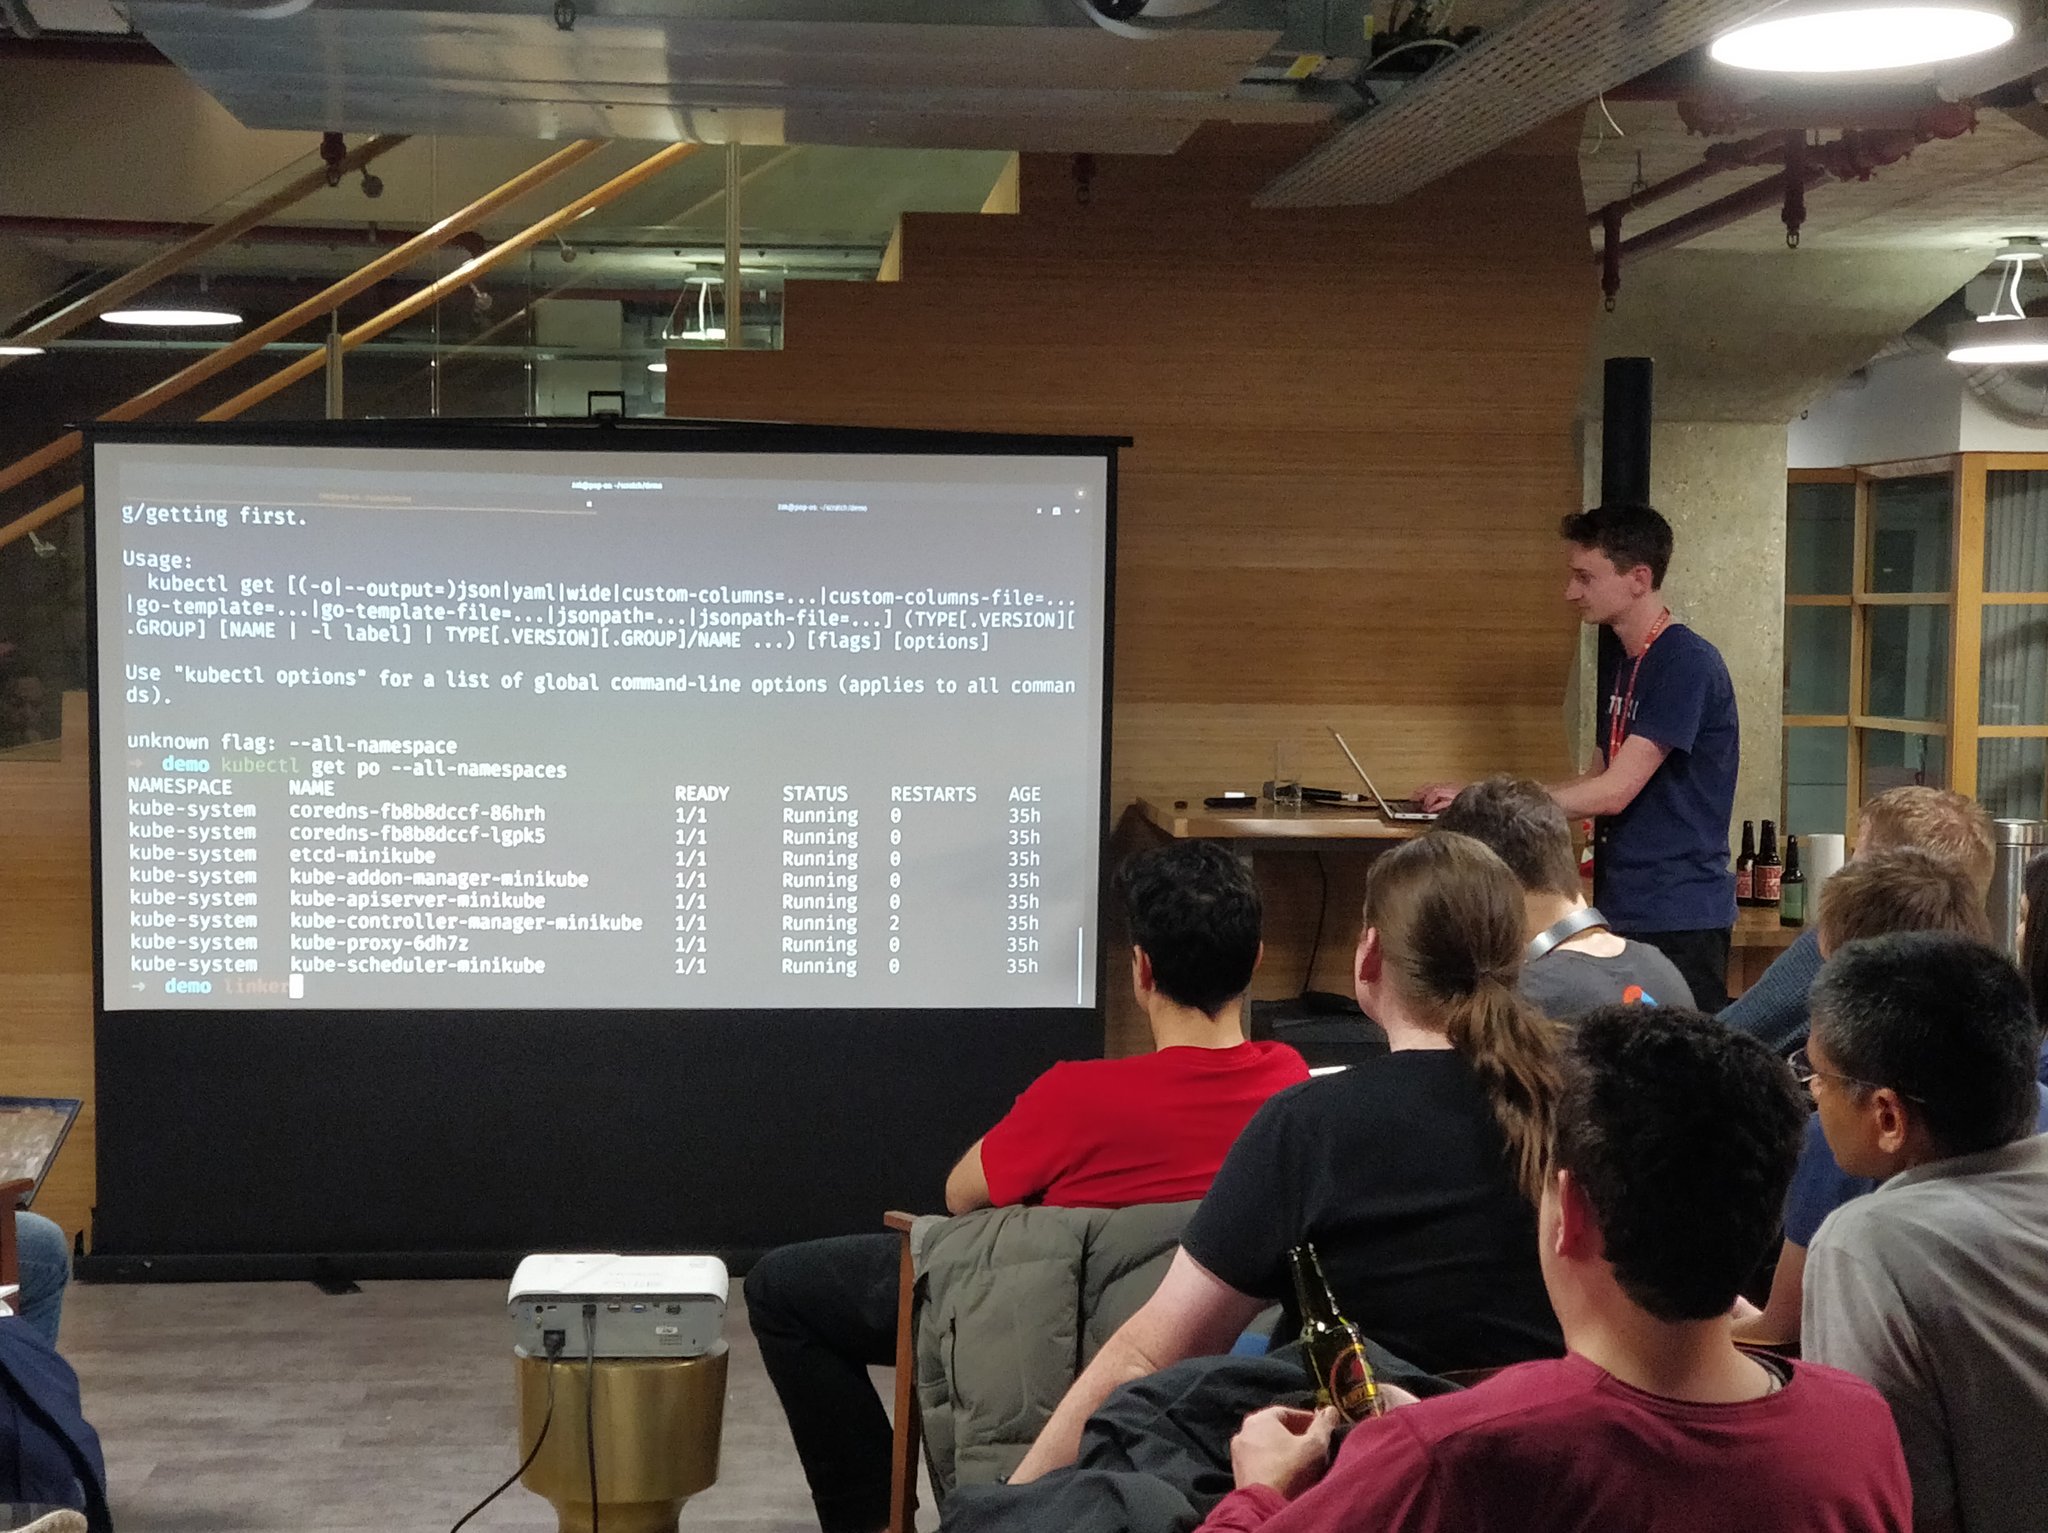
Demo
To show the power of linkerd2, the talk includes a demo which takes an empty kubernetes cluster (minikube) and in < 4 minutes we:
- Install the linkerd2 control plane from scratch with zero config
- Install a demo app in the cluster
- Inject linkerd proxy into the demo app
- View metrics and grafana
- Use the linkerd2 dashboard and cli tooling to debug failing requests in the demo app.
Linkerd2
Linkerd2 has massively increased the confidence that we, and our feature teams have in being able to debug and resolve incidents. It allows for out of the box metrics and our teams become empowered to own the services that they create.
Without the metrics and observability tooling that linkerd2 provides we would not have been able to move as fast with as much confidence. There are of course other tools, (e.g. envoy), but the simplicity and ease of install / use of linkerd2 was a huge reason that we chose it.